
If you’ve ever dabbled in algorithmic trading, you’ve probably encountered the Moving Average Crossover Strategy. It’s one of those strategies that sounds almost too simple to be true—yet it’s been a staple in the trading toolkit for years. But does it actually work? Let’s dive into the nitty-gritty of this strategy to find out its real potential.
What Is the Moving Average Crossover Strategy?
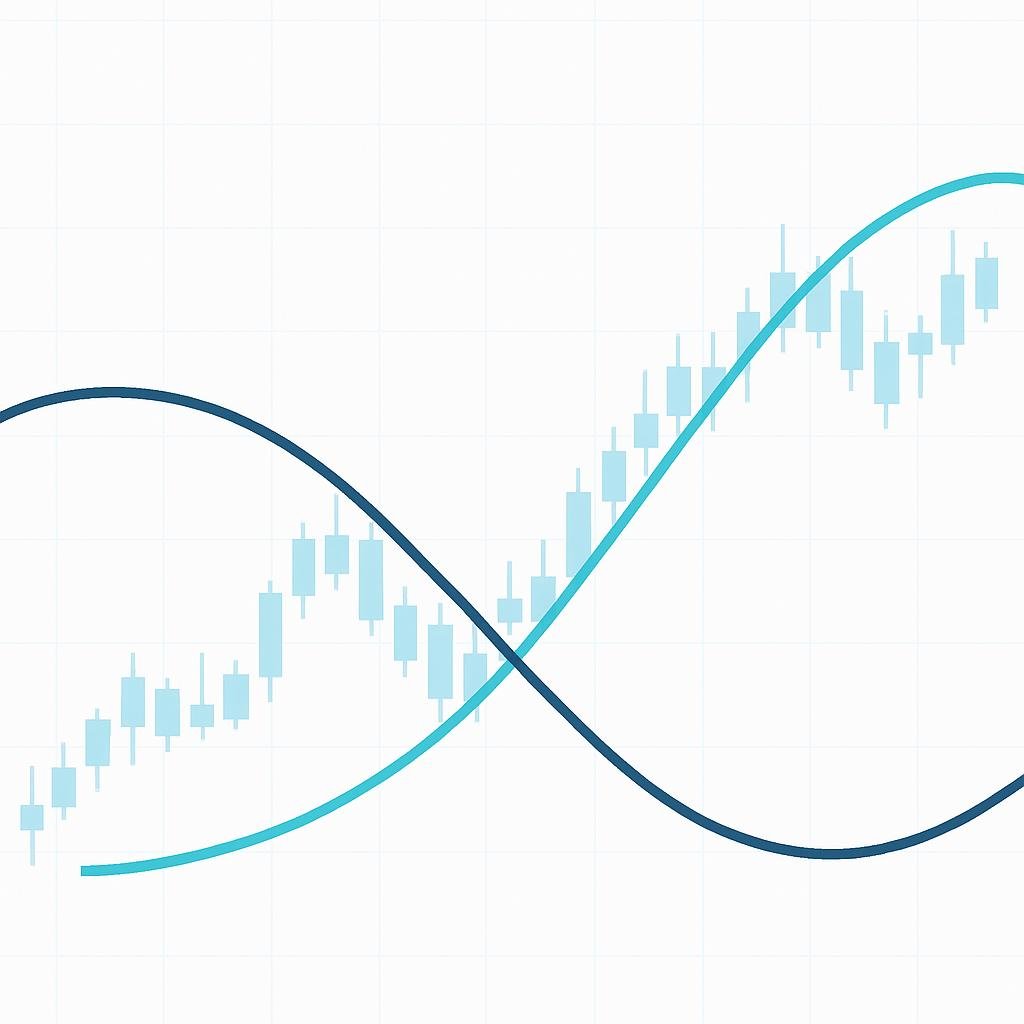
The Moving Average Crossover Strategy is an algorithmic trading method that uses moving averages (MAs) to identify potential buy and sell signals. It’s based on the idea that when a short-term moving average crosses above a long-term moving average, it signals a bullish trend, while a cross below indicates a bearish trend. Traders use these signals to make decisions about entering or exiting trades.
In essence, the strategy exploits the natural ebb and flow of price movements, aiming to capture trends by relying on these crossovers. The two most commonly used types of moving averages in this strategy are the Simple Moving Average (SMA) and the Exponential Moving Average (EMA).
How It Works
The Moving Average Crossover Strategy boils down to a few simple steps:
- Choose Your Moving Averages: Typically, traders use a short-term moving average (like the 50-day SMA) and a long-term moving average (like the 200-day SMA).
- Identify Crossovers: A bullish signal occurs when the short-term MA crosses above the long-term MA. Conversely, a bearish signal is generated when the short-term MA crosses below the long-term MA.
- Make Trading Decisions: Based on these signals, traders decide whether to enter or exit positions.
The strategy is visually straightforward, and many traders appreciate its simplicity. However, its effectiveness can vary, which we’ll explore in more detail below.
Step-by-Step Guide
Here’s a practical guide to implementing the Moving Average Crossover Strategy in your trading:
- Select Your Trading Platform: Choose a platform that supports algorithmic trading and allows you to configure moving averages. Platforms like MetaTrader, TradingView, or even some broker-provided platforms can be suitable.
- Set Up Moving Averages: Select the moving averages you want to use. A common setup is the 50-day SMA for short-term trends and the 200-day SMA for long-term trends. On your platform, configure these moving averages on your preferred chart.
- Define Entry and Exit Rules: Write down your trading rules. For example, enter a long position when the 50-day SMA crosses above the 200-day SMA. Conversely, exit or short the position when the 50-day SMA crosses below the 200-day SMA.
- Backtest Your Strategy: Before using real money, backtest the strategy on historical data. This helps you understand how the strategy would have performed in different market conditions.
- Monitor and Adjust: Once live, regularly review the strategy’s performance. Market conditions change, and sometimes you’ll need to tweak the parameters, such as the length of your moving averages.
Common Mistakes to Avoid
While the Moving Average Crossover Strategy is straightforward, traders often fall into certain pitfalls:
- Ignoring Market Context: Moving averages work well in trending markets but can produce false signals in sideways or choppy markets. Always consider the broader market context.
- Over-Optimizing: Avoid the temptation to over-optimize your moving averages to fit historical data. This can lead to a strategy that performs well in backtesting but poorly in live trading.
- Neglecting Risk Management: Always implement robust risk management practices. Set stop-loss orders and use position sizing to protect your capital.
- Using Too Many Indicators: While it’s tempting to combine multiple indicators, too many can lead to analysis paralysis. Stick to a few that complement the moving averages.
Real-World Examples
Let’s look at a couple of real-world scenarios to see how the Moving Average Crossover Strategy can play out:
Example 1: Bull Market
Imagine it’s 2021, and the stock market is on a bullish run. Using the 50-day and 200-day SMAs on a major stock index, you notice the 50-day SMA crosses above the 200-day SMA in March. This crossover signals a potential buying opportunity. You enter a long position and ride the trend upward, capturing gains as the market continues its upward trajectory.
Example 2: Sideways Market
Fast forward to 2022, and the market is moving sideways. The same strategy might produce several false signals as the moving averages crisscross back and forth. In this environment, you might find that the strategy gives you more losses than gains, highlighting its limitations in non-trending markets.
Final Thoughts
The Moving Average Crossover Strategy is a time-tested tool in the world of algorithmic trading. Its simplicity and ease of implementation make it a popular choice among traders. However, like any strategy, it has its strengths and weaknesses. It tends to perform well in trending markets but can falter in sideways conditions.
Ultimately, whether this strategy works for you will depend on how well you understand its mechanics and how adeptly you adapt it to changing market conditions. Consider it a starting point for your trading journey, and don’t hesitate to combine it with other indicators and risk management practices to enhance its effectiveness.
Remember, the world of trading is as much an art as it is a science. The Moving Average Crossover Strategy can be a valuable brush in your trading toolkit, but it’s up to you to paint the picture of success.